yum upgrades for production use, this is the repository for you.
Active subscription is required.
The NGINX Graphite module collects per-location performance metrics from your NGINX server and sends them directly to Graphite (Carbon) for monitoring and visualization. Instead of parsing access logs or scraping status pages, this module aggregates stats in shared memory and transmits calculated values over UDP or TCP at configurable intervals — without affecting request processing.
Developed and battle-tested at Mail.Ru (one of Russia’s largest web services), the NGINX Graphite module tracks request rates, response times, bytes transferred, HTTP status code distribution, upstream cache hit rates, and more. It also supports percentile calculations, conditional metric collection, and multiple aggregation intervals.
Why Use the NGINX Graphite Module?
NGINX provides a built-in stub_status module that exposes basic connection and request counters. However, stub_status has significant limitations:
- It only reports global totals (active connections, total requests)
- It provides no per-location breakdown
- It offers no response time tracking
- It has no status code distribution (2xx vs 4xx vs 5xx)
- It requires an external scraper to poll the endpoint
The NGINX Graphite module solves all of these problems. It pushes granular, per-location metrics directly to your Graphite server, giving you deep visibility into how each endpoint performs.
For an alternative approach using an in-NGINX dashboard, see the NGINX VTS Module article. If you need scriptable request handling alongside monitoring, the Lua NGINX Module can complement the Graphite module with custom metric injection.
How It Works
The NGINX Graphite module operates in three stages:
- Collection: A log-phase handler runs after each request completes. It records metrics (response time, bytes sent, status code, etc.) into a fixed-size shared memory zone accessible by all worker processes.
-
Aggregation: Metrics are aggregated using configurable functions — averages, sums, per-second rates, or gauges — across configurable time intervals (e.g., 1 minute, 5 minutes).
-
Transmission: A timer fires at a configurable frequency (default: every 60 seconds). It reads the aggregated values from shared memory and sends them to Carbon in Graphite’s plaintext protocol (
metric.path value timestamp\n) over UDP or TCP.
Because all aggregation happens in shared memory with a fixed allocation, the module adds minimal overhead to request processing. The network send is non-blocking and happens on a timer, not in the request path.
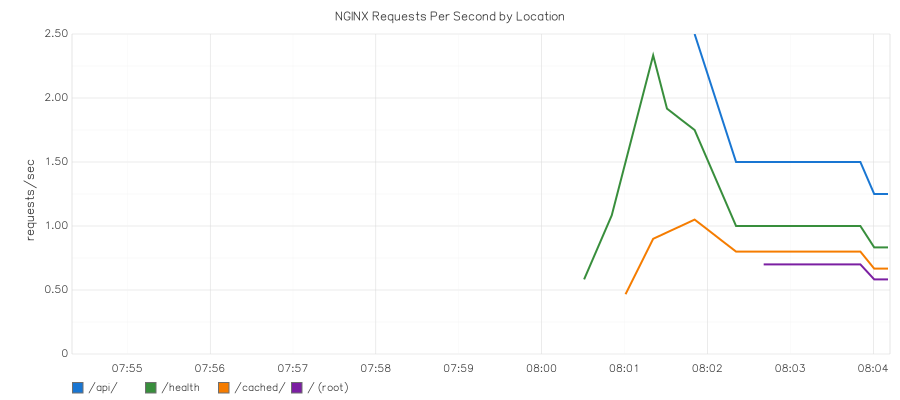
The screenshot below shows real per-location RPS metrics collected by the NGINX Graphite module and rendered in Graphite’s web interface:
Installation
RHEL, CentOS, AlmaLinux, Rocky Linux
sudo dnf install https://extras.getpagespeed.com/release-latest.rpm
sudo dnf install nginx-module-graphite
Then load the module by adding the following at the top of /etc/nginx/nginx.conf, before the events block:
load_module modules/ngx_http_graphite_module.so;
For more details on the RPM package, see the nginx-module-graphite RPM page.
Debian and Ubuntu
First, set up the GetPageSpeed APT repository, then install:
sudo apt-get update
sudo apt-get install nginx-module-graphite
On Debian/Ubuntu, the package handles module loading automatically. No
load_moduledirective is needed.
For more details, see the nginx-module-graphite APT page.
Configuration
The NGINX Graphite module provides four directives. All metric collection is configured declaratively in the NGINX configuration file.
graphite_config
Context: http
This is the global configuration directive. It must appear exactly once in the http block. All parameters are specified as key=value pairs.
http {
    graphite_config prefix=myapp server=10.0.0.50 protocol=udp port=2003
                    frequency=60 intervals=1m|5m shared=2m buffer=64k;
    # ...
}
| Parameter | Required | Default | Description |
|---|---|---|---|
prefix |
No | (empty) | Path prefix prepended to all metric names |
host |
No | gethostname() |
Hostname inserted into metric paths |
server |
Yes | — | IP address of the Carbon (Graphite) server |
protocol |
No | udp |
Transport protocol: udp or tcp |
port |
No | 2003 |
Carbon plaintext receiver port |
frequency |
No | 60 |
How often to send data to Graphite, in seconds |
intervals |
No | 1m |
Aggregation intervals, separated by \| (e.g., 1m\|5m\|15m) |
params |
No | (all default) | Limit which metrics to track, separated by \| |
shared |
No | 1m |
Shared memory zone size (e.g., 2m, 4m) |
buffer |
No | 64k |
Network send buffer size |
package |
No | 1400 |
Maximum UDP packet size in bytes |
template |
No | $prefix.$host.$split.$param_$interval |
Template for metric path names |
timeout |
No | 100 |
Connection timeout in milliseconds (TCP only) |
Minimal configuration:
graphite_config prefix=myapp server=127.0.0.1;
Production configuration with multiple intervals:
graphite_config prefix=prod.nginx server=10.0.0.50 protocol=udp
                intervals=1m|5m params=rps|request_time|response_2xx_rps|response_4xx_rps|response_5xx_rps
                shared=4m;
graphite_data
Context: http, server, location, if
Creates a measurement point that collects metrics for the enclosing location. Each graphite_data directive defines a unique metric path prefix. The built-in metrics (request time, bytes sent, status codes, etc.) are collected automatically for every request that matches the location.
location /api/ {
    graphite_data myapp.api;
    proxy_pass http://backend;
}
Optional parameters:
params=rps|request_time— Override which metrics to collect for this location (default: all metrics fromgraphite_config)if=$variable— Only collect metrics when the variable evaluates to a non-empty, non-zero value
You can combine both params and if in a single graphite_data directive:
graphite_data nginx.arg params=rps|request_time if=$is_tracked;
Multiple measurement points per location:
You can use multiple graphite_data directives in the same location. This is useful for conditional metric splitting:
map $scheme $is_https {
    https 1;
    default 0;
}

server {
    location /api/ {
        graphite_data myapp.api.all;
        graphite_data myapp.api.https if=$is_https;
        proxy_pass http://backend;
    }
}
With this configuration, myapp.api.all receives metrics for every request, while myapp.api.https only counts HTTPS traffic. Over plain HTTP, the HTTPS metrics remain zero — giving you a clear split between encrypted and unencrypted traffic.
graphite_default_data
Context: http, server
Automatically creates measurement points for all nested locations. Use the special variables $location and $server to generate dynamic metric paths based on location and server names. Non-alphanumeric characters are replaced with underscores.
http {
    graphite_config prefix=myapp server=10.0.0.50;
    graphite_default_data myapp.$server.$location;

    server {
        server_name api.example.com;

        location /users/ {
            proxy_pass http://backend;
        }

        location /orders/ {
            proxy_pass http://backend;
        }
    }
}
In this example, metrics are automatically sent to paths like myapp.api_example_com.users and myapp.api_example_com.orders — no per-location graphite_data directive needed.
Optional parameter: You can pass one additional argument — either params= to limit collected metrics, or if= for conditional collection:
graphite_default_data myapp.$location params=rps|request_time;
or:
graphite_default_data myapp.$location if=$is_tracked;
Note: Unlike
graphite_data, thegraphite_default_datadirective accepts at most one optional parameter. You cannot combineparams=andif=in the same directive. If you need both conditional collection and custom params, usegraphite_datainside each location instead.
graphite_param
Context: http, server, location, if
Declares a custom metric with explicit aggregation. This directive defines a named metric bucket — but does not automatically collect data from requests. Custom params are designed to be populated from Lua code using the ngx.graphite() API.
| Parameter | Required | Description |
|---|---|---|
name |
Yes | Metric path name |
aggregate |
Yes* | Aggregation function: sum, persec, avg, or gauge |
interval |
Yes* | Aggregation interval (must not exceed the maximum interval in graphite_config) |
percentile |
Yes* | Percentile level (alternative to aggregate + interval) |
* Either aggregate + interval, or percentile must be specified.
Aggregation functions:
| Function | Description |
|---|---|
sum |
Total sum of values during the interval |
persec |
Sum divided by seconds in the interval (per-second rate) |
avg |
Average value during the interval |
gauge |
Last written value (not time-windowed) |
Example with Lua (requires lua-nginx-module):
location /checkout/ {
    graphite_param name=myapp.checkout_total aggregate=sum interval=1m;
    graphite_param name=myapp.checkout_rps aggregate=persec interval=1m;
    graphite_data myapp.checkout;

    content_by_lua_block {
        ngx.graphite("myapp.checkout_total", 1)
        ngx.graphite("myapp.checkout_rps", 1)
        ngx.say("OK")
    }
}
Without Lua, graphite_param metrics will report zero. For automatic request metrics (request time, RPS, status codes), use graphite_data instead.
Important: The interval value in graphite_param must not exceed the maximum interval defined in graphite_config. For example, if graphite_config sets intervals=1m, then graphite_param cannot use interval=5m.
Available Metrics
The following built-in metrics are available when using the NGINX Graphite module as a dynamic module (the standard installation method from GetPageSpeed packages). These metrics are collected automatically by graphite_data and graphite_default_data:
| Metric | Units | Aggregation | Description |
|---|---|---|---|
request_time |
ms | avg | Total time spent serving the request |
bytes_sent |
bytes | avg | Total HTTP response length |
body_bytes_sent |
bytes | avg | HTTP response body length (excludes headers) |
request_length |
bytes | avg | HTTP request length (including headers and body) |
ssl_cache_usage |
% | last | SSL session cache utilization percentage |
rps |
rps | sum | Requests per second |
keepalive_rps |
rps | sum | Requests per second over keep-alive connections |
response_2xx_rps |
rps | sum | 2xx (success) responses per second |
response_3xx_rps |
rps | sum | 3xx (redirect) responses per second |
response_4xx_rps |
rps | sum | 4xx (client error) responses per second |
response_5xx_rps |
rps | sum | 5xx (server error) responses per second |
Per-Status-Code Tracking
Beyond the broad response_Nxx_rps groups, the NGINX Graphite module can track specific HTTP status codes using the pattern response_XXX_rps. For example:
graphite_config prefix=myapp server=10.0.0.50
                params=rps|response_200_rps|response_404_rps|response_503_rps;
This sends separate metrics for each specified status code, allowing you to alert on specific error conditions like a spike in 503 responses.
Upstream Cache Status Tracking
If you use NGINX’s proxy cache, you can track cache hit rates with the NGINX Graphite module:
graphite_config prefix=myapp server=10.0.0.50
                params=rps|upstream_cache_hit_rps|upstream_cache_miss_rps|upstream_cache_expired_rps;
Available upstream cache statuses: miss, bypass, expired, stale, updating, revalidated, hit.
Metrics Requiring NGINX Source Patch
The following metrics are not available when the module is installed as a dynamic module. They require patching the NGINX source code before compilation:
ssl_handshake_time— Time spent on SSL/TLS handshakecontent_time— Time spent generating content inside NGINXgzip_time— Time spent on gzip compressionupstream_time— Time communicating with upstream serversupstream_connect_time— Time establishing upstream connectionupstream_header_time— Time receiving upstream response headerslua_time— Time spent executing Lua code
For most monitoring use cases, the default metrics provide sufficient visibility. The request_time metric captures the full end-to-end latency, which is typically the most important indicator.
Percentile Calculations
The NGINX Graphite module can calculate percentiles for any metric. Append /<level> to the parameter name to enable percentile tracking. Multiple percentile levels are separated with |.
graphite_config prefix=myapp server=10.0.0.50
                params=rps|request_time|request_time/50|request_time/90|request_time/99;
This configuration produces metrics like:
myapp.hostname.location.request_time_p50 0.5
myapp.hostname.location.request_time_p90 2.3
myapp.hostname.location.request_time_p99 15.7
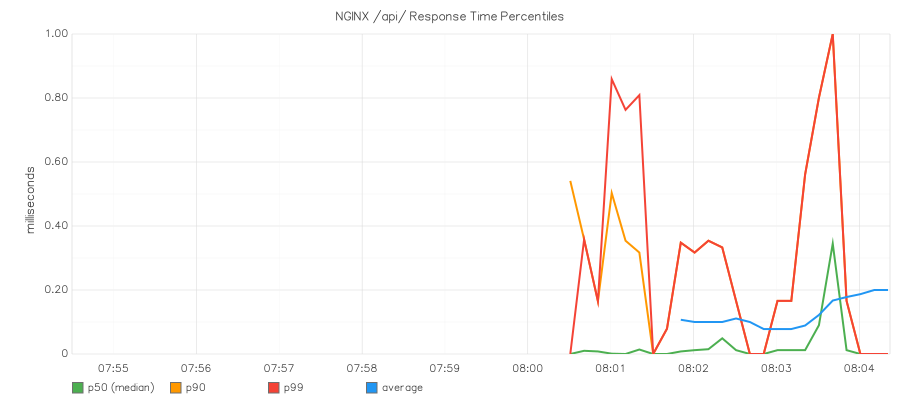
Percentiles are invaluable for understanding the true user experience. An average response time of 100ms may hide the fact that 1% of users wait over 5 seconds. The p99 value reveals those outliers.
The chart below shows real p50, p90, and p99 response time percentiles captured from NGINX by the Graphite module:
Multiple Aggregation Intervals
You can aggregate the same metrics over different time windows simultaneously. Shorter intervals give faster feedback, while longer intervals smooth out noise.
graphite_config prefix=myapp server=10.0.0.50 intervals=1m|5m;
Each metric is sent with an interval suffix in its path:
myapp.hostname.api.rps_1m 150.5
myapp.hostname.api.rps_5m 142.3
myapp.hostname.api.request_time_1m 12.4
myapp.hostname.api.request_time_5m 11.8
The 1-minute interval is ideal for dashboards and alerting, while 5-minute or 15-minute intervals work better for trend analysis.
Metric Path Template
The default metric path template is $prefix.$host.$split.$param_$interval, where:
$prefix— The value from theprefixparameter$host— The hostname (fromhostparameter or system hostname)$split— The metric path fromgraphite_dataorgraphite_default_data$param— The metric name (e.g.,rps,request_time)$interval— The aggregation interval (e.g.,1m,5m)
You can customize this template:
graphite_config prefix=nginx server=10.0.0.50
                template=$prefix.$host.$split.$param_$interval;
Testing Your Configuration
After configuring the NGINX Graphite module, verify the configuration syntax:
nginx -t
To verify that metrics are actually being transmitted, use nc (netcat) to listen on the Carbon port:
# Listen for UDP data on port 2003
nc -u -l 2003
Then generate some traffic and wait for the configured frequency interval (default: 60 seconds). You should see lines in Graphite’s plaintext format:
myapp.hostname.api.rps_1m 5.000 1709827200
myapp.hostname.api.request_time_1m 12.345 1709827200
myapp.hostname.api.response_2xx_rps_1m 4.833 1709827200
myapp.hostname.api.response_4xx_rps_1m 0.167 1709827200
Each line contains the metric path, value, and Unix timestamp.
Performance Considerations
The NGINX Graphite module is designed for minimal performance impact:
- Fixed memory allocation: Shared memory is allocated at startup and never resized. No dynamic allocation occurs during request processing.
- Non-blocking sends: Metric data is transmitted on a timer, not in the request path. A slow or unreachable Graphite server does not delay request processing.
- Efficient aggregation: Metrics are aggregated incrementally. Each request simply updates counters in shared memory — a fast O(1) operation.
Sizing Shared Memory
The default shared memory size is 1 MB. If you track many locations or use many metrics and intervals, you may need to increase it:
graphite_config prefix=myapp server=10.0.0.50 shared=4m;
If the shared memory zone is too small, NGINX logs an error:
graphite too small shared memory
Increase the shared value when you see this message. A good starting point for servers with many locations is 4m to 8m.
UDP vs TCP
UDP is the default and recommended protocol for most deployments:
- UDP: Fire-and-forget, no connection overhead, no backpressure. If Graphite is down, packets are silently dropped. Best for high-frequency metric sends.
- TCP: Reliable delivery with connection overhead. Use when metrics must not be lost, or when Graphite runs on a remote network where UDP packets might be dropped.
# TCP with custom timeout
graphite_config prefix=myapp server=10.0.0.50 protocol=tcp timeout=200;
SELinux note: On RHEL-based systems with SELinux enforcing, you must allow NGINX to make outbound network connections for TCP mode. Run
setsebool -P httpd_can_network_connect 1. Without this, NGINX logsgraphite connect failed (13: Permission denied).
UDP Packet Size
If you have many metrics and the data exceeds the maximum UDP packet size, the module splits the data across multiple packets. The default maximum packet size is 1400 bytes, chosen to avoid IP fragmentation on typical networks. Adjust with the package parameter if needed:
graphite_config prefix=myapp server=10.0.0.50 package=1400;
Troubleshooting
“too small shared memory” Error
Increase the shared parameter in graphite_config:
graphite_config prefix=myapp server=10.0.0.50 shared=8m;
“too small buffer size” Error
Increase the buffer parameter:
graphite_config prefix=myapp server=10.0.0.50 buffer=128k;
“param interval value is greater than max interval” Error
The interval in graphite_param exceeds the largest interval defined in graphite_config. For example, this fails:
graphite_config prefix=myapp server=10.0.0.50 intervals=1m;

location / {
    # ERROR: 5m > 1m (max interval)
    graphite_param name=myapp.custom aggregate=avg interval=5m;
}
Fix by adding the required interval to graphite_config:
graphite_config prefix=myapp server=10.0.0.50 intervals=1m|5m;
“unknown param” Error
You are trying to use a metric that requires patching the NGINX source code. When installed as a dynamic module, only the default metrics are available. Metrics like upstream_time, ssl_handshake_time, content_time, and gzip_time require a static build with the included NGINX source patch.
“connect failed (13: Permission denied)” Error
On RHEL-based systems with SELinux enforcing, NGINX is not allowed to make outbound TCP connections by default. Enable the httpd_can_network_connect boolean:
sudo setsebool -P httpd_can_network_connect 1
This is required for TCP protocol mode. UDP mode does not typically trigger this error.
No Data Arriving in Graphite
- Check NGINX error log for graphite-related messages
- Verify network connectivity: Can the NGINX server reach the Carbon server on the configured port?
- Check the frequency: Default is 60 seconds. Wait at least one full interval after generating traffic.
- Test with netcat: Run
nc -u -l 2003on the Graphite server to confirm packets arrive - Check SELinux: If using TCP mode, ensure
httpd_can_network_connectis enabled
Complete Configuration Example
Here is a production-ready configuration that monitors an API server with multiple endpoints. This example demonstrates how the NGINX Graphite module integrates with a typical reverse proxy and load balancing setup:
load_module modules/ngx_http_graphite_module.so;

user nginx;
worker_processes auto;
error_log /var/log/nginx/error.log warn;
pid /var/run/nginx.pid;

events {
    worker_connections 1024;
}

http {
    include /etc/nginx/mime.types;
    default_type application/octet-stream;

    graphite_config prefix=prod.nginx server=10.0.0.50
                    intervals=1m|5m
                    params=rps|request_time|request_time/90|request_time/99|bytes_sent|response_2xx_rps|response_4xx_rps|response_5xx_rps
                    shared=4m;

    graphite_default_data prod.$server.$location;

    upstream backend {
        server 10.0.0.10:8080;
        server 10.0.0.11:8080;
    }

    server {
        listen 80;
        server_name api.example.com;

        location / {
            proxy_pass http://backend;
        }

        location /health {
            graphite_data prod.health params=rps;
            return 200 "OK\n";
        }

        location /static/ {
            graphite_data prod.static params=rps|bytes_sent;
            root /var/www;
        }
    }
}
This configuration sends metrics like:
prod.nginx.hostname.prod.api_example_com._.rps_1m— Overall requests per secondprod.nginx.hostname.prod.api_example_com._.request_time_p90— 90th percentile response timeprod.nginx.hostname.prod.health.rps_1m— Health check request rateprod.nginx.hostname.prod.static.bytes_sent_1m— Static file bandwidth
Note that locations with both graphite_default_data and explicit graphite_data will produce two sets of metrics — one from each directive. This is by design and allows you to track the same endpoint under different metric path hierarchies.
Conclusion
The NGINX Graphite module transforms NGINX from a black box into a rich source of per-location performance telemetry. For system administrators running Graphite-based monitoring stacks, it eliminates the need for log parsing pipelines and status page scrapers. Metrics flow directly from NGINX’s request processing into your dashboards.
The module is available as a pre-built package from the GetPageSpeed repository for RHEL-based systems and from the APT repository for Debian and Ubuntu. The source code is on GitHub.